One Connector URL, Every Community Asset, Live
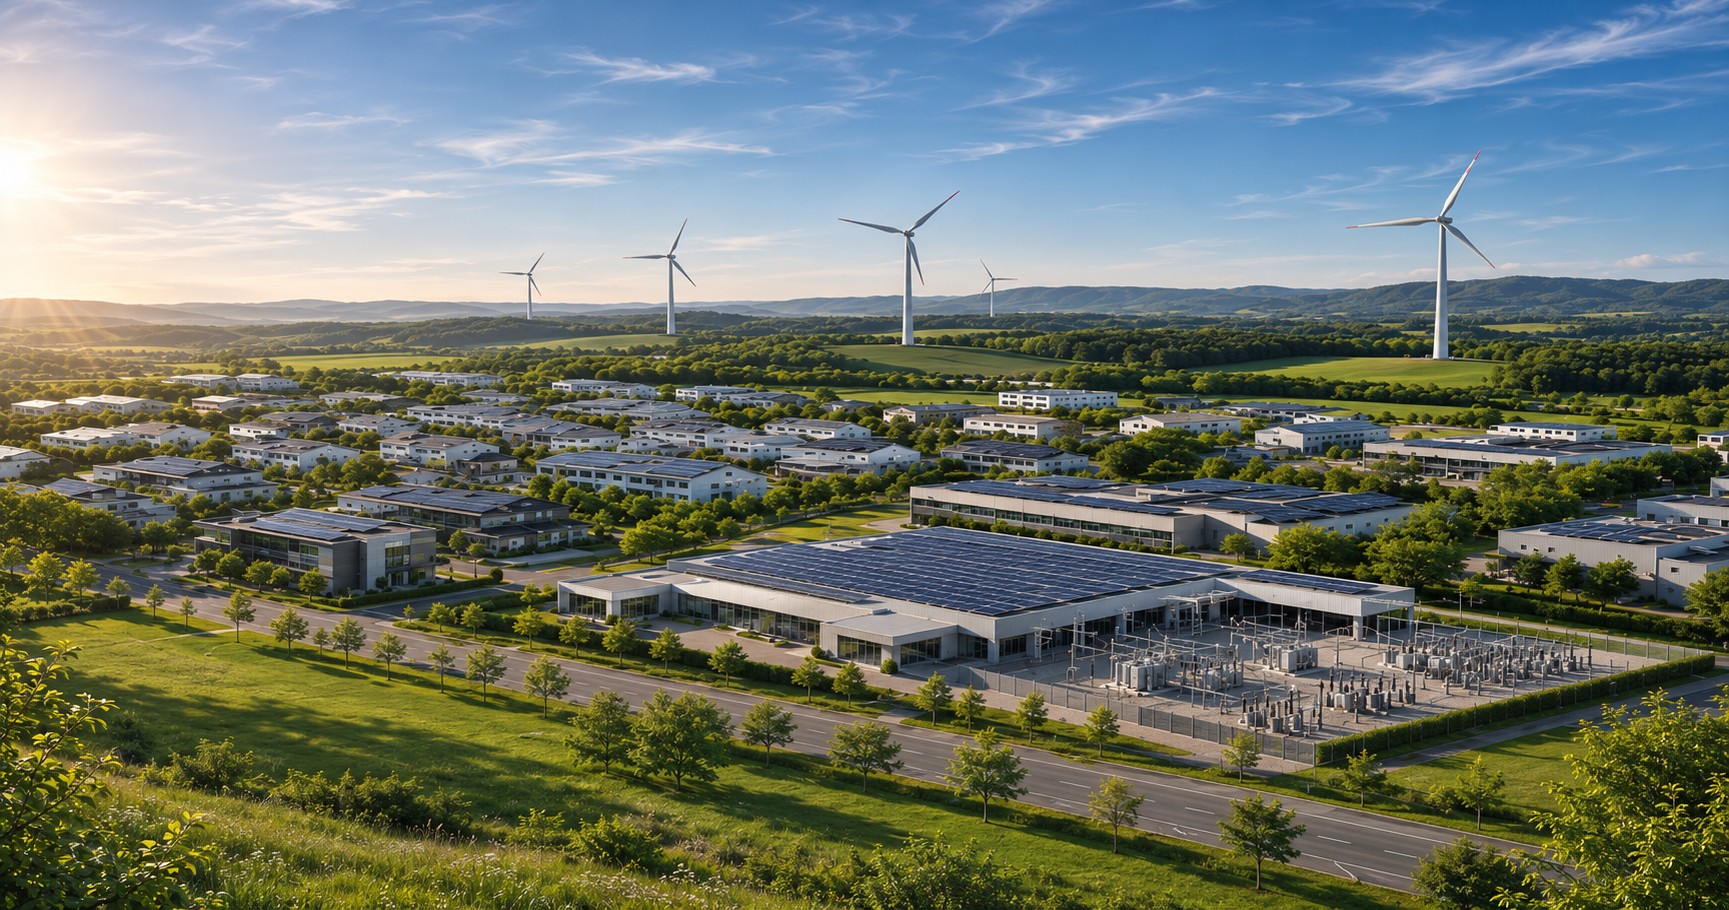
An energy community’s real-time state usually lives across separate monitoring systems, one per building, one per turbine, one per solar array. P2X pulls it all onto a single screen the moment a manager enters one connector endpoint, with no custom integration work required.
Challenge
An energy community manager needs to know, in real time, how much each building is consuming, how much the solar panels and wind turbines are generating, and whether the community as a whole is a net consumer or producer at any given moment. Today that information is scattered across separate monitoring systems for each asset, with nothing pulling it into a single, unified view.
Building a custom integration for every data source is one option, but it takes months, and the point-to-point connections it produces are brittle: they tend to break as soon as a participant changes.
Solution
The community manager places markers on the map for each asset, building consumption points, wind turbines, PV installations, then clicks Connect to Dataspace and enters the streaming endpoint of the community’s EDC connector. As soon as Connect is clicked, the button turns green to show Streaming Live, and five chart groups below the map begin filling with real-time data covering electricity consumption, heat, P2X, virtual community metrics, and renewable generation, refreshing every 60 seconds.
Switching to a different community or data source is just a matter of disconnecting and entering a new endpoint URL. Because the platform speaks to any EDC-compatible connector, the same interface works regardless of which community, asset types, or data provider sits behind that URL.
Benefits
Skip Months of Custom Integration
One connector URL replaces the point-to-point integration work that would otherwise be needed for every asset and data source.
See the Whole Community on One Screen
Consumption, generation, and net community position appear together in real time, instead of spread across separate monitoring systems.
Switch Communities Without Rebuilding Anything
Moving to a different community or data source is as simple as disconnecting and entering a new endpoint, with no new integration to build.
Works with Any EDC-Compatible Connector
The same interface connects to different communities, asset types, and data providers, so the tool doesn’t need to be rebuilt as participants change.
Stay Current Every 60 Seconds
Telemetry from every connected building, wind turbine, and PV installation streams continuously, refreshing on a 60-second cadence rather than waiting on a manual check.
Go Live with a Single Click
Enter the connector URL, click Connect, and watch live energy data from the entire community appear on the map immediately.