Watch a Burned Forest Heal, Month by Month
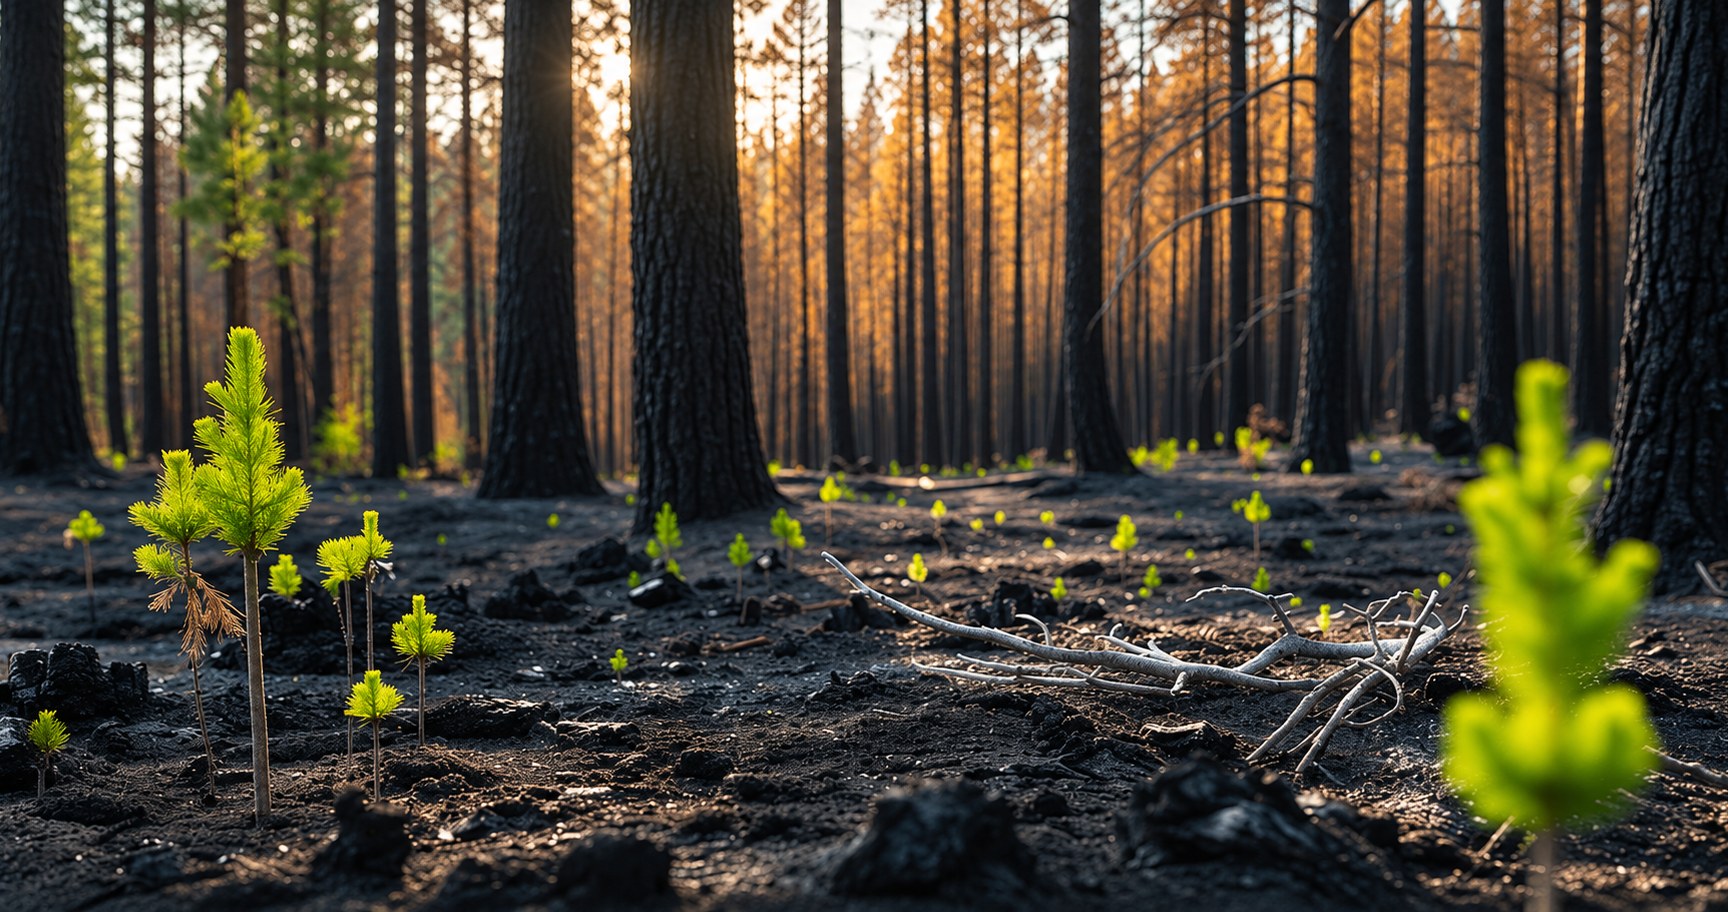
A time-slider that shows an entire burned landscape regreening month by month gives decision-makers something field reports never could: a continuous, visual record of recovery instead of a handful of scattered snapshots. That’s what the LAI estimation service in AI-Builder-Suite turns satellite imagery into.
Challenge
After a wildfire, environmental agencies need to monitor how vegetation recovers over months and years. Today, this often relies on occasional field surveys or manual interpretation of satellite images, making it difficult to track recovery consistently across large burned areas.
Solution
Using the LAI estimation service, the user uploads Sentinel-2 images from different dates after the fire. The model generates LAI maps that quantify vegetation regrowth over time.
Recovery can then be assessed by comparing post-fire LAI values with pre-fire conditions or with nearby unburned reference areas, replacing the scattered field checks and manual image analysis agencies previously relied on.
Reliability is supported through time-series consistency checks, comparison with burn severity maps, and expert review, so agencies can monitor vegetation regrowth continuously rather than through occasional spot checks.
Benefits
Monitor Recovery Continuously
Track vegetation regrowth across an entire burned area through consistent LAI time-series maps, rather than relying on scattered field checks.
Compare Against Reference Conditions
Assess recovery objectively by comparing post-fire LAI values with pre-fire data or nearby unburned reference areas.
Support Confident Decision-Making
Validate recovery trends with time-series consistency checks and comparison with burn severity maps, backed by expert review.
Visualize Recovery at a Glance
Use a time-slider view to see vegetation regrowth unfold month by month across the entire burned area.
Digitize a Manual Process
Replace fragmented field surveys and manual image interpretation with a structured, repeatable monitoring workflow.